ICD User Guide
![]()
ICD User Guide |
|
CHAPTER 3 INTRODUCTION TO THE DATA SETS
Market value measures the overall value of the market or segment, measured at retail sales price. The market value therefore includes all sales taxes. All distribution channels are included in the calculation. All market value data points are actual up to 2003, and forecast beyond.
Market Value data can be viewed within the ICD in a number of ways:
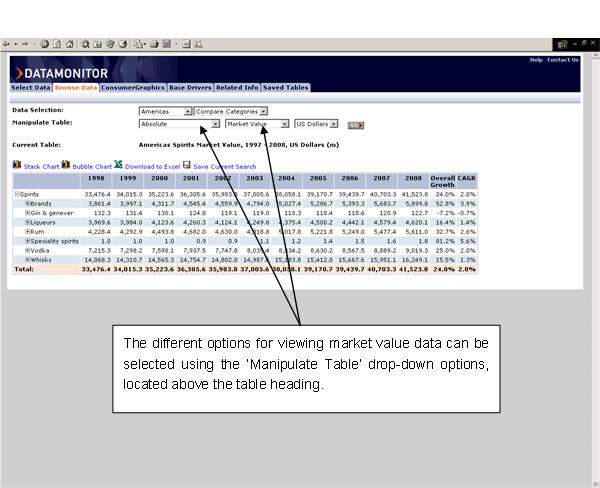
Expenditure per capita data is the value of the market divided by the size of the country or region’s population. This data can be viewed by selecting the market value then choosing ‘Expenditure per Capita’ via the drop-down box.
The population data used in the calculation can be viewed via the Base Drivers tab.
Market Volume measures the volume of sales of a product or category. It is normally measured in liters, kilograms, or units, depending on the category selected. The units used are referenced above each table.
Market Volume tables can be manipulated in a number of ways:
Per capita consumption data is simply the volume of the market divided by the size of the country or region’s population. This data can be viewed by selecting the market volume then choosing ‘Consumption per Capita’ via the drop-down box.
The population data used in the calculation can be viewed via the Base Drivers tab.
Brand share data is provided within ICD. The data is normally available at a category level (e.g. Potato Chips) as well as at a market level (e.g. Savory Snacks).
Market level brand share data is calculated by summing the brand shares at a category level and cross referencing against the size of the market. For regional data, individual country brand share data is aggregated together to form an overall brand share.
Brand share data can be viewed in tabular format, or alternatively a pie chart can be displayed.
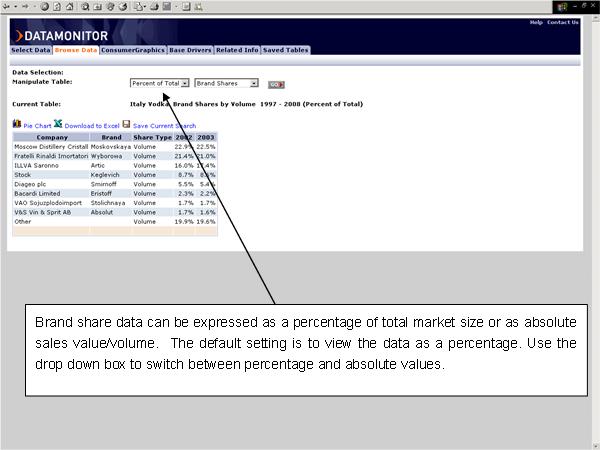
As well as brand share data, ICD contains company shares, which are the overall shares held in a category or market by a particular company. They are calculated by adding up the share of each company’s brands in a market. In some cases this means a company’s market share may be underestimated, because the contribution of minor brands not tracked in the brand share data may not always be included.
As with brand share data, company shares can be expressed as a percentage of total market size or as absolute sales value/volume. The default setting is to view the data as a percentage. The drop down box is used to switch between percentage and absolute values.
Distribution data measures the proportion of the market value accounted for by different sales channels. Typically these include supermarkets, traditional grocers, discounters, convenience stores, kiosks and service stations though these may vary depending on the market being viewed.
A full list of distribution channels and definitions used in ICD can be found here.
Distribution channel data can be viewed as either a % of the total value, or as an absolute value. The default setting is to view the data as a percentage. The drop down box is used to switch between percentage and absolute values.
Distribution channel data can be viewed in tabular format, or alternatively a pie chart can be displayed.
For certain countries and markets, Datamonitor may have additional data segmenting the market in a different way from its standard product classifications.
If additional data exists within the ICD for any particular country or market, a link called “Alternative Segmentation” will appear immediately above the data table. Clicking on this link will cause a new window to open, which will display the additional data in a separate table.
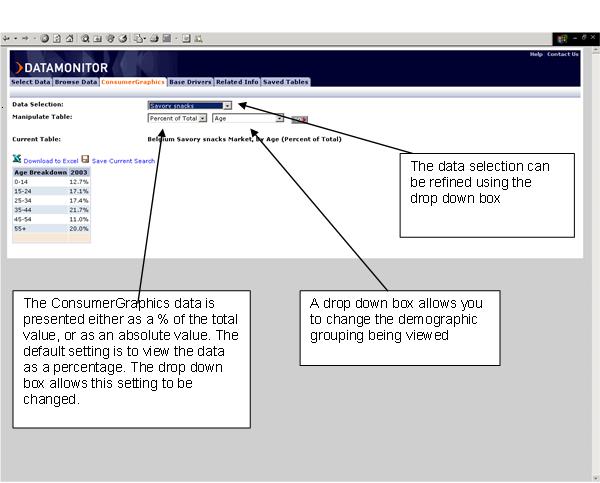
ConsumerGraphics data is designed to help you understand the key consumer segments within a marketplace, to help identify underserved consumer segments or target advertising and marketing campaigns to the right areas.
The ConsumerGraphics data provided within the ICD breaks down the total value of each category into different demographic groupings (for example, the proportion of French popcorn market consumed by people living in one-person households).
ConsumerGraphics data is calculated based on the value of products consumed by people belonging to the relevant demographic group.
The demographic groups covered include:
Base Drivers represent the key underlying factors driving market growth, for example demographic and macro economic factors. They represent both the key factors influencing market growth and useful comparators to market performance.
Access base drivers information via the dedicated tab across the top of the screen. By clicking on this tab, options to view base drivers in the countries selected will be presented.
Information included in base drivers includes:
Key Demographic Market Drivers
Key Economic Market Drivers
© Datamonitor 2004