ICD User Guide
![]()
ICD User Guide |
|
2.3 Using the Drop-down Options
ICD has been designed to offer a simple, intuitive user interface. Wherever possible the database has been programmed to be manipulated by a single click, whether you wish drill down deeper through markets, change the data set being viewed, chart data or switch from market to consumergraphics or base drivers data sets.
Datamonitor also offers user training and analyst support, all within the cost of subscription.
For help or more information regarding this please email us at icd@datamonitor.com
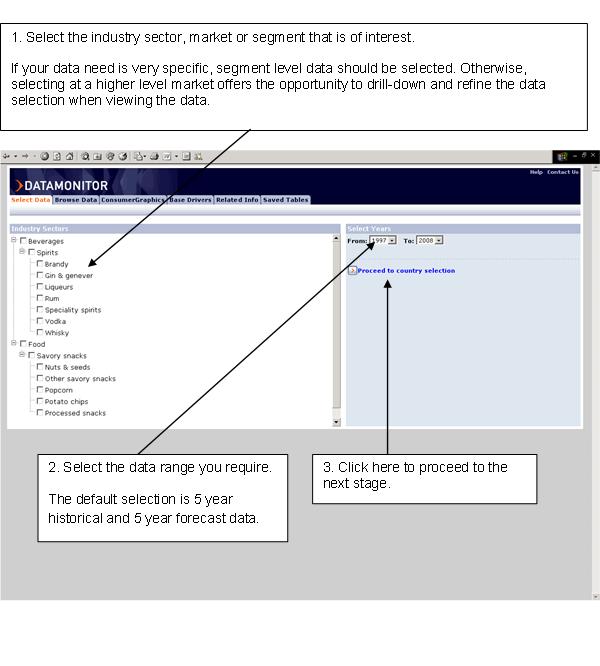
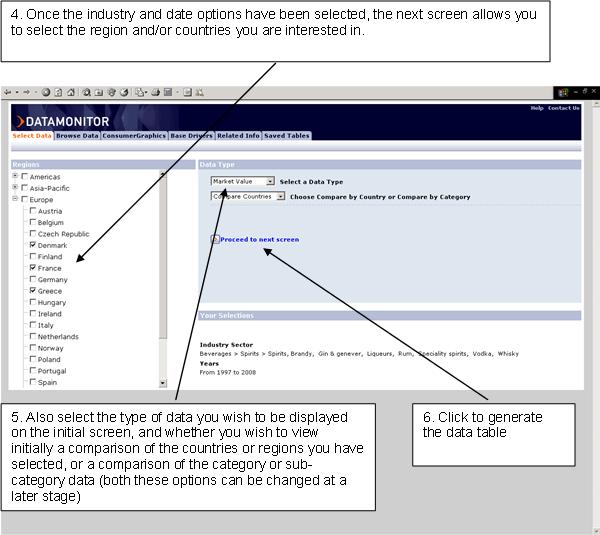
The initial data table required should be selected through the first tab on the ICD – the “Select Data” tab.
Once the data table has been selected, it can be manipulated in various ways using the drop-down options presented on screen.
Changing the data selection
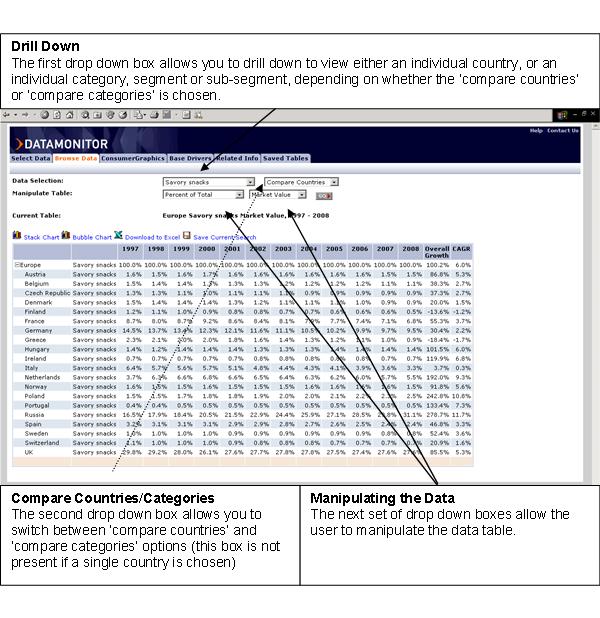
When manipulating the data, the options available to select will depend on the actual data present in the table. However typically these boxes allow for changes of data type (e.g. from market value to brand share or distribution channels), changes of currency (from local currency to US$, for example), and changes in how the data is viewed (as absolute values, % of total, or indexed, for example). A fuller explanation of the different data options can be seen here.
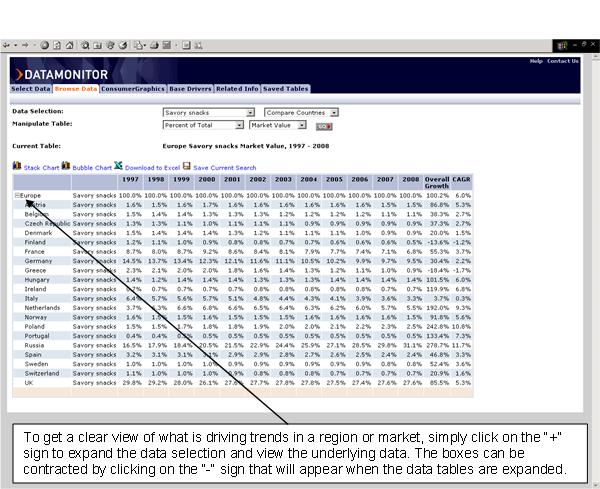
Expandable boxes are present on all the data tables, where there is data present at a deeper level. These boxes are designed to make drilling down through the data easier.
ICD is designed with 6 horizontal tabs to make it easier for the user to switch between functions and back again without losing the data selected. For example, a user can switch from viewing market data to viewing ConsumerGraphics or Base Drivers data and then back to the original data selection.
The exception to this rule is the ‘Select Data’ tab. Clicking on this tab resets the data selection and starts a new selection, and unless ‘save table’ has been selected the original data selection will be lose.
Until the ‘Select Data’ screen has been completed, some of the other tabs are not available.
The six tabs are:
1. Select Data
The initial and main way of selecting new tables. How to use the data function is explained in more detail here.
2. Browse Data
This is the main screen where data tables are viewed. Once data has been selected the ICD moves automatically to this tab for display and manipulation of the data table.
3. ConsumerGraphics
This tab shows the consumergraphics data tables. The tab is not available until data has been selected, and all data selections are retained from the Browse Data screen.
More information about ConsumerGraphics
4. Base Drivers
This tab shows base drivers data for the countries selected and displayed on the ‘Browse Data’ screen
More Information about Base Drivers
5. Related Info
This tab brings up all the relevant news, comment and Datamonitor research to the markets being examined. Access to news and comment is provided as part of the ICD subscription. For access to additional Datamonitor premium research, a separate subscription is required.
6. Saved Tables
The ICD offers each user the option to save as many tables as required, in order to save time in recreating the data selected. Each table can be individually named, and deleted when you have no more use for it.
ICD offers charting capabilities for all data tables. For market value and volume charts, data can be charted as a stack chart by clicking on the link titled “Stack Chart”. This gives a representation of market size and segmentation.
Additionally, bubble charts are available for value and volume data. They are generated by clicking on the “Bubble Chart” link located above the data table. Bubble charts offer an intuitive way of comparing historical vs. forecast growth rates across countries and categories.
In the Brand Share, Company Share and Distribution sections of the ICD, pie charts can be generated to represent % shares, by clicking on the link marked “Pie Chart”.
Although ICD is designed to offer you the ability to manipulate the data online to the greatest extent possible, for certain types of calculation our users will require the data in a spreadsheet format.
Because of this, every data table that can be generated with the ICD can be exported into a neatly formatted excel workbook, giving you the ability to manipulate the data still further and incorporate within your own market models.
To export the data simply click on the “download to excel” link located at the top of the table. This will launch the data in excel format in a separate window.
Note: Microsoft Excel is required to be installed in order for this functionality to work.
The ICD offers each user the option to save as many tables as required, in order to save time in recreating the data selections. Each table can be individually named, and deleted when you have no more use for it.
© Datamonitor 2004